Source data stops too early
Clicks and leads are visible, but the connection to qualified conversations, proposals and revenue is unclear.
Analytics + Optimization
Connect source, ownership, pipeline movement, proposals, closed business and revenue in one decision system—so your team knows what to protect, repair and scale.

The measurement gap
Marketing reports, sales notes and revenue records often describe different parts of one customer journey. Without shared definitions and ownership, teams react to volume instead of understanding movement.
Clicks and leads are visible, but the connection to qualified conversations, proposals and revenue is unclear.
Opportunities enter the system without a reliable owner, next action or standard for meaningful progress.
Static summaries explain what happened but do not help operators decide what deserves attention now.
The connected model
Magnivara structures measurement around the decisions a team must make. Every signal should clarify who arrived, who owns the next move and what commercial outcome followed.
Identify the channel, message, page or campaign that created a meaningful first interaction.
Give each qualified opportunity a responsible owner, defined stage and visible next action.
Follow proposals, closes and recognized revenue back to the activity that helped create them.
One commercial language
A useful system defines the signals at every transition, then keeps those definitions consistent across marketing, sales and operations.
Which channel and message created the first qualified interaction?
Was enough useful information captured to route and continue the conversation?
Who owns the opportunity, where does it stand and what must happen next?
Which qualified conversations reached a defined offer or buying decision?
What closed, what stalled and what reason explains the final disposition?
Which sources, offers and operating patterns contribute to realized revenue?
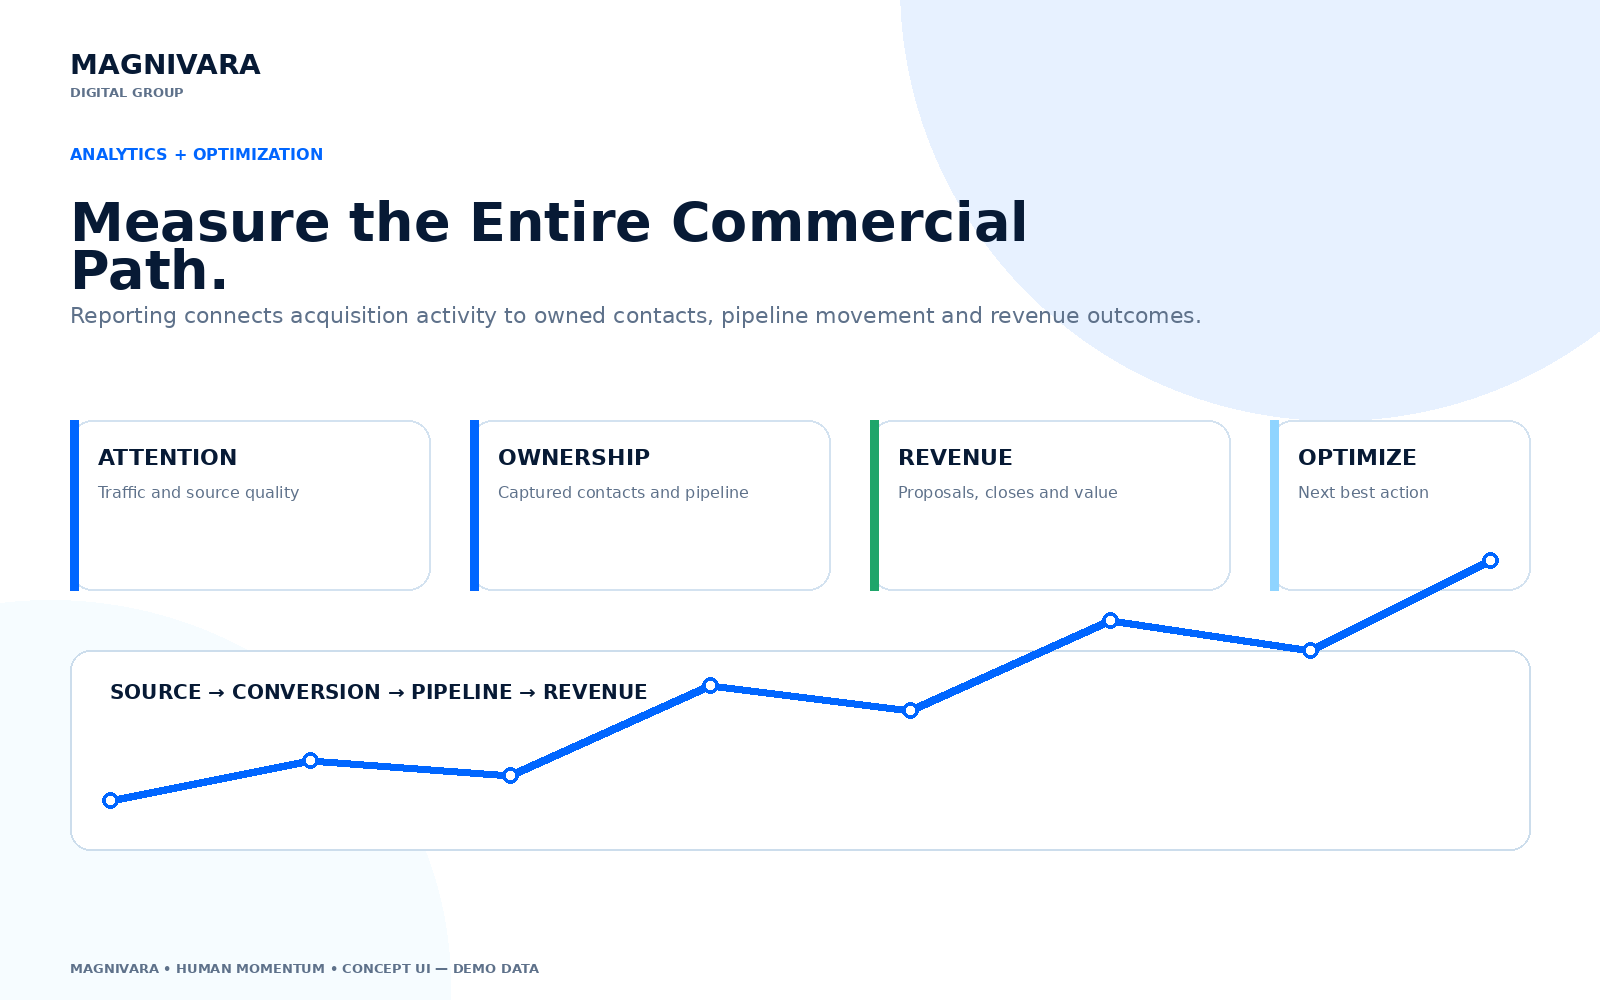
Operational visibility
This operating view brings commercial signals into one context, helping leaders move from observation to action without translating between disconnected reports.
Attribution with context
Attribution is most valuable when it supports operating decisions. The goal is not artificial certainty; it is a more reliable view of the interactions, ownership and progression behind revenue.
Identify sources, experiences and follow-up patterns associated with qualified movement.
Locate handoff delays, stage friction and unowned opportunities before they become invisible losses.
Turn evidence into a focused decision about messaging, routing, process, experience or investment.
Continuous optimization
Optimization works when teams repeat a disciplined cycle: observe what is happening, prioritize the most meaningful constraint, test a focused change and scale what proves useful.
Distinguish a real operating pattern from isolated activity.
Select the constraint tied most clearly to movement or revenue.
Introduce one controlled change with a defined question and owner.
Keep, expand or retire the change based on evidence and usefulness.
Implementation method
The system starts with commercial reality: how attention enters, how opportunities move, how ownership works and which outcomes matter. Technology follows that operating model.
Establish shared definitions for sources, qualified activity, stages, proposals, closes and revenue.
Structure how relevant data moves between touchpoints, ownership and commercial records.
Give each role the signals and context needed to make its next decision clearly.
Create a repeatable cadence for reviewing evidence, choosing changes and learning.
Questions leaders ask
Not necessarily. Useful systems can often be organized into a clearer measurement layer before replacement is considered.
Implementation can begin with the minimum trustworthy signals, then improve definitions and data quality in stages.
No. The model connects acquisition signals with ownership, pipeline movement, proposals, closes and revenue.
Attribution is treated as decision support, with assumptions and data limits visible so teams can interpret signals responsibly.
Build from clearer signals
Create a measurement system that connects attention, ownership and revenue—and gives your team a more useful next move.